
Building Your Sales Performance Tracking Foundation
Let's be honest, tracking sales performance can quickly turn into an exercise in vanity. It's easy to get lost in a sea of data, celebrating "activity metrics" like the number of calls made or emails sent. While these numbers might look good on a report, they often tell you very little about what’s actually working. The real goal is to build a tracking system that cuts through the noise and focuses on what truly drives results.
This shift from tracking activity to measuring real performance is why the global Sales Performance Management market hit $7.11 billion in 2024 and is projected to reach $8.07 billion in 2025. You can get more details on this trend from The Business Research Company's latest report. This spending isn't just for fancy software; it reflects a core truth: what you measure is what your team will focus on, and that focus directly impacts your bottom line.
Identifying Your Core Predictive Metrics
Before you start tracking anything, you need a solid plan. It starts with understanding the difference between lagging indicators (like closed revenue) and leading indicators (the activities that predict those outcomes). Revenue is the ultimate goal, but it's a look back at the past. By the time you see the final numbers for a quarter, it's too late to change them. Smart performance tracking shines a light on the leading indicators, giving you the foresight to make adjustments before the quarter ends.
Instead of overwhelming your team with 20 different data points, start with a handful of metrics that have a direct line to winning deals in your sales process. Here are a few foundational metrics to consider:
- Lead-to-Opportunity Conversion Rate: This shows you what percentage of your qualified leads are turning into real, active deals. It's a great way to gauge the quality of your leads and the effectiveness of your team's initial conversations. A low rate might mean your lead generation needs work or your team's qualification process is off.
- Sales Cycle Length: How long does it take for a deal to go from an opportunity to a closed-won deal? If you notice this number starting to creep up, it could be an early warning sign. Maybe there's a new friction point in your sales process, or perhaps market conditions are changing.
- Average Deal Size: Keeping an eye on this tells you if your team is successfully moving upmarket or if deal values are starting to shrink. This metric is a key part of your profitability puzzle, especially when you weigh it against your customer acquisition costs. We've got a great guide on how to reduce customer acquisition cost if you want to dig deeper here.
- Pipeline Coverage: This is a simple but powerful ratio: your total open pipeline value divided by your sales quota. A healthy ratio, often around 3-4x depending on your industry, acts as a buffer and gives you confidence in your future revenue.
For any of this to work, the data has to be clean and trustworthy. The best way to ensure data integrity is to automate data entry whenever possible. This not only reduces human error but also gives your reps more time to do what they do best: sell.
Choosing CRM Systems That Actually Work
After you’ve nailed down your core metrics, the next move is to find the right tool to track them. A solid Sales CRM system is the backbone of modern sales performance tracking. It’s easy to get wowed by flashy demos and endless feature lists, but the best CRM is the one your team consistently uses. I’ve seen too many companies invest in overly complex platforms only to watch them collect digital dust, a costly mistake that leads to poor adoption and unreliable data.
The real goal isn't to find a CRM with every bell and whistle imaginable. It's about finding one that slots into your team's workflow without creating friction. Think beyond the monthly subscription fee—consider the hidden costs like painful data migration, extensive training, and the inevitable productivity dip as everyone gets up to speed. A clunky or slow interface is the quickest way to send your reps back to their old-school spreadsheets, making your performance data totally useless.
What to Prioritize in a CRM
When you're looking at different CRMs, put user experience first. If it takes more than a handful of clicks to log a call or update a deal, that’s a major red flag. Look for platforms that offer powerful but simple reporting and dashboard customization. You want to make tracking performance a natural part of the daily grind, not another administrative headache. For most teams, simplicity and speed are everything.
Here's what to keep an eye on:
- Ease of Use: Is the interface intuitive? Can a new sales rep get the hang of it without a week-long training course?
- Mobile Access: Your team is often on the go. Can they update deals and pull up data right from their phones?
- Integration Capability: Does it play well with the other tools you rely on, like your email client and calendar?
- Reporting Simplicity: Can you easily build and share reports based on the KPIs you've already defined?
The data backs this up. The right CRM can truly change how a company tracks performance. As of 2025, a staggering 94% of businesses report a significant boost in sales productivity after getting their CRM set up. The numbers are hard to ignore: companies with a well-matched CRM can see up to a 29% increase in sales revenue and a 34% jump in overall sales productivity.
To help you sift through the options, here's a comparison of some popular platforms known for their sales tracking features.
CRM Platform Comparison for Sales Performance Tracking
A detailed comparison of leading CRM platforms focusing on sales tracking capabilities, pricing, and key features
| Platform | Sales Tracking Features | Monthly Cost | Best For | Integration Options |
|---|---|---|---|---|
| Salesforce | Advanced forecasting, customizable dashboards, AI-powered insights (Einstein), comprehensive pipeline management. | Starts at $25/user | Large enterprises needing deep customization and scalability. | Extensive AppExchange with thousands of integrations (Slack, G Suite, etc.). |
| HubSpot | Visual pipeline tracking, automated sales sequences, call and email tracking, detailed reporting on sales activities. | Free version available; Sales Hub starts at $45/month. | Small to mid-sized businesses looking for an all-in-one sales and marketing platform. | Native integrations with marketing, service hubs, and a large app marketplace. |
| Zoho CRM | AI-powered sales assistant (Zia), performance management tools, real-time reporting, gamification for sales reps. | Starts at $14/user | SMBs and mid-market companies seeking a feature-rich, cost-effective solution. | Integrates with Zoho Suite and other popular third-party apps like G Suite and Office 365. |
| Pipedrive | Visual sales pipeline, activity-based selling prompts, customizable reports, goal tracking. | Starts at $14.90/user | Sales teams that want a simple, visually-driven tool focused purely on deal management. | Robust API and a marketplace with over 300 integrations. |
Ultimately, each of these platforms has its strengths. Salesforce is the powerhouse for complex operations, while HubSpot excels for teams wanting an integrated marketing and sales tool. Pipedrive keeps things simple and focused, and Zoho offers a great balance of features and affordability. The "best" one is whichever fits your team's daily habits.
This infographic shows a manager reviewing key performance indicators on a modern dashboard, a direct outcome of a well-chosen CRM.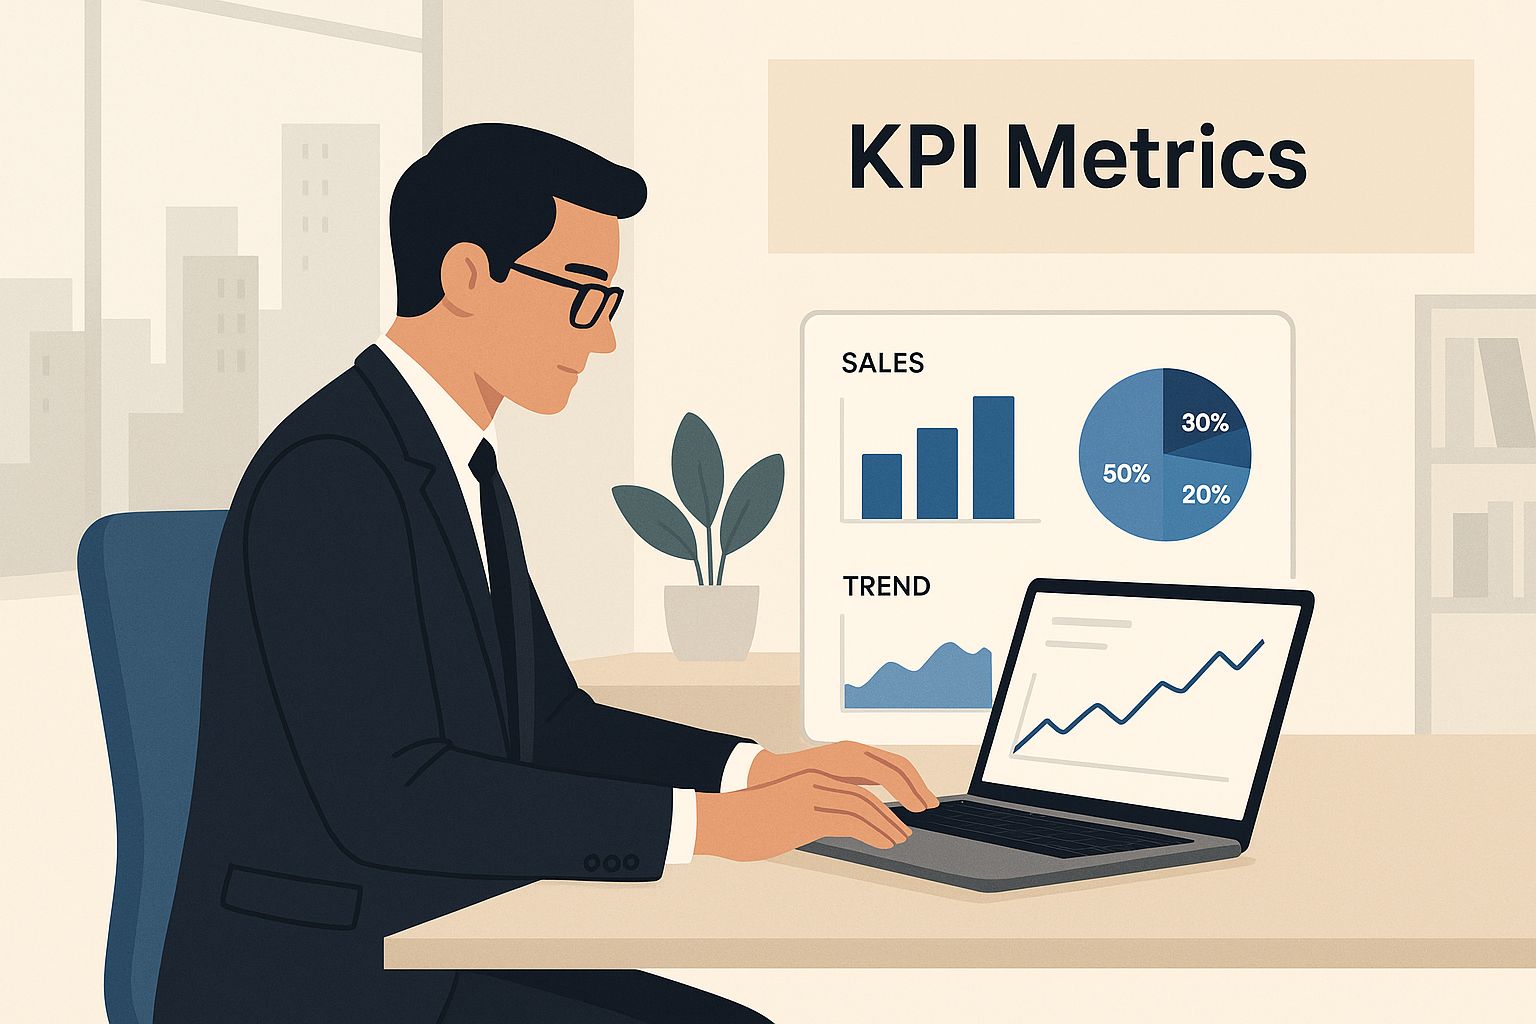
This is what it's all about—turning raw data into clear, actionable insights that help you guide your team effectively. By putting user adoption first and focusing on your core tracking needs, you’ll choose a system that becomes a true asset, not just a glorified digital filing cabinet.
Creating Dashboards That Drive Action
Once your CRM is collecting quality data, the next step is to transform it into a clear picture of what’s happening. This is where your dashboard comes in. Think of it as your sales team’s command center—a single screen that tells you everything you need to know at a glance. Too often, though, dashboards become a digital graveyard of unused reports, cluttered with metrics that create more confusion than clarity. The goal is to design something so useful that your team wants to check it daily.
High-performing teams don't just dump every available metric onto one screen. They are ruthless about what gets prime real estate. The key is to create a visual hierarchy that tells a story, guiding the viewer from high-level outcomes to the underlying activities that drive them.
Designing for Clarity and Motivation
Effective dashboards are built around roles. A sales rep needs a different view than a sales manager, and designing with their specific needs in mind makes all the difference.
For the Sales Rep: Their dashboard should be a personal motivator. It needs to clearly show their progress toward quota, their current pipeline value, and their most important leading indicators, like upcoming meetings or open tasks. The focus is on individual accountability and action. The central question it answers is: What do I need to do today to hit my number?
For the Sales Manager: The manager’s dashboard is all about team health and forecasting. It should highlight team-wide metrics like total pipeline coverage, win rate trends, and sales cycle length. This view is less about individual tasks and more about spotting patterns. For instance, if the average deal size is shrinking across the team, it's a signal to investigate. This kind of data is also essential for developing better projections. If you want to dive deeper into this, our guide on sales forecasting methods can offer some valuable frameworks.
Visuals That Spark Action
The psychology of data visualization is crucial here. Use simple, clean charts that anyone can understand in seconds. A bar chart is great for comparing rep performance, while a line chart effectively shows a trend over time, like lead conversion rates. Use color intentionally—green for good, red for areas needing attention. This isn't just about making it pretty; it's about making the data instantly understandable.
Another powerful technique is setting up automated alerts for key metrics. For instance, an alert can trigger if a high-value deal has had no activity for over a week. These alerts should be rare and meaningful, drawing attention to problems that require immediate intervention. By focusing on what truly matters, you create a dashboard that doesn't just report on the past but actively shapes future success.
Mastering Digital Sales Performance Tracking
Let's be honest: the old ways of tracking sales performance are broken. Simply counting calls or meetings just doesn’t cut it anymore. Today's buyer journey is a complex dance across social media feeds, email chains, video calls, and website visits, all happening long before a sales rep even gets a chance to make their pitch. To figure out what's actually driving results, we need to track performance in this messy, multi-channel world.

This means we need to stop obsessing over simple activity logs and start measuring the quality of digital interactions. Instead of just noting that an email was sent, we should be digging into open rates, click-through rates, and even the sentiment of replies. These data points paint a much clearer picture of how engaged a prospect is and tell us which messages are actually hitting the mark.
Integrating Digital Touchpoints and Automation
The most successful sales teams are the ones that pull all these digital signals directly into their CRM. This creates a complete, living timeline of every customer relationship. It includes everything from social selling efforts—like a connection request on LinkedIn or engagement with company content—to the more formal sales conversations. The goal is to see the entire digital footprint, not just the parts that fit neatly into a "sales activity" box.
This is where automation and AI become your best friends. The numbers speak for themselves: by 2025, it's estimated that 80% of B2B sales interactions will occur on digital platforms. Teams that are already using AI tools are seeing a 50% boost in leads and appointments because automation is handling the repetitive work of prospecting and follow-ups. This frees up reps to do what they do best: have meaningful, high-value conversations.
On top of that, 70% of B2B marketers are using AI-driven personalization to lift engagement rates by 35%. You can learn more about these shifts and their impact on B2B sales in this insightful breakdown of sales statistics.
The real key is using technology to connect the dots for you, giving you a full view of performance that reflects how people actually buy things today. For a deeper look at how to refine your team's approach, you might find our guide on effective sales coaching techniques helpful. This mindset changes performance tracking from a backward-glancing chore into a strategic tool that helps you understand not just what happened, but why.
Implementing KPIs That Predict Success
Exceptional sales performance isn't just about working hard; it's about working smart. The critical difference often comes down to what you measure. While activity metrics like calls logged might make your team look busy, they don't actually predict success. The real key to tracking sales performance is identifying the Key Performance Indicators (KPIs) that act as an early warning system, giving you a clear view of future revenue long before the quarter ends. This means shifting your focus from what reps did to how effectively their actions are moving deals forward.
A common mistake is treating every deal with the same level of urgency. High-performing teams, however, are obsessed with deal velocity, which measures how quickly opportunities move through your pipeline. If deals are consistently getting stuck at a specific stage—say, the proposal review—it's a massive red flag. It doesn't matter how many new opportunities you create if none of them are progressing. A slowing deal velocity is often the first sign of trouble, signaling issues with your pricing, process, or even a shift in the market.
Identifying Your Leading Indicators
To get ahead of these problems, you need to concentrate on leading indicators—metrics that predict future outcomes. These are unique to every business but often revolve around the quality of relationships and engagement. For example, instead of just tracking "demos booked," a more predictive KPI would be the "percentage of demos that result in a next-step meeting." This simple change shifts the focus from sheer quantity to quality engagement.
Similarly, you can measure the depth of a relationship by tracking the number of stakeholders engaged within a target account. One contact is just a lead; three or four engaged contacts represent a real, embedded opportunity. This type of multi-threading significantly increases your odds of closing a deal, making it a powerful predictive metric. For those expanding into new regions, building these deep relationships is crucial. You can find more on this in our guide covering a complete framework for scaling B2B sales in Ireland.
From Lagging Results to Predictive Action
Let’s put this into a practical framework. Instead of only looking at lagging indicators like win rate, focus on the metrics that directly influence it. The table below breaks down some essential KPIs by sales stage, helping you pinpoint exactly where your process is strong and where it needs work.
To make this more tangible, here's a look at some essential KPIs broken down by sales stage. This framework helps you move from reacting to past results to proactively managing future outcomes.
| Essential Sales Performance KPIs by Sales Stage | ||||
|---|---|---|---|---|
| Sales Stage | Primary KPI | Target Range | Tracking Frequency | Warning Signs |
| Prospecting | Lead-to-Meeting Conversion Rate | 10-15% | Weekly | Low rates suggest poor lead quality or weak outreach. |
| Qualification | Meeting-to-Opportunity Conversion | 50-60% | Weekly | A drop indicates reps are struggling to establish value. |
| Proposal | Proposal-to-Close Rate | 25-30% | Bi-Weekly | Low rates signal issues with pricing or value proposition. |
| Negotiation | Average Sales Cycle Length | 30-60 Days | Monthly | Increasing length means deals are stalling before the finish line. |
| A comprehensive breakdown of key performance indicators organized by sales funnel stage with target benchmarks |
By focusing on predictive KPIs, you stop managing by looking in the rearview mirror. Instead, you get a clear, forward-looking view of your pipeline's health. This empowers you to coach your team and make strategic adjustments that directly impact your bottom line.
Transforming Data Into Performance Breakthroughs
Raw data on its own is just noise. The real skill in tracking sales performance is turning those numbers into meaningful conversations that actually drive revenue. This is what separates effective sales management from simple scorekeeping. It’s not about just staring at a dashboard; it’s about having performance conversations that inspire your team to take action, rather than making them defensive. Great leaders have a knack for seeing the story behind the data, spotting patterns that reveal hidden opportunities or systemic problems long before they become full-blown crises.
From Data Points to Coaching Moments
Let’s say you notice a rep's win rate has dipped by 10% over the last quarter. A reactive manager might just flag the lagging metric, which often leads to frustration. A data-driven coach, however, digs a little deeper. They might see that the rep’s average sales cycle for lost deals is 15 days longer than for their won deals. This isn't a failure—it's a clue.
Armed with this insight, the conversation completely changes. It goes from "Your win rate is down" to "It looks like we're spending a lot of time on deals that aren't panning out. Let's work together on the qualification stage." This simple shift turns a performance review into a collaborative problem-solving session. By focusing on leading indicators like qualification criteria, you give your team the tools to fix issues proactively. This kind of continuous coaching is powerful; research shows it can help salespeople spend 23% more time selling.
Predicting and Preventing Performance Dips
The best managers don't just use data to review the past; they use it to look into the future. For example, if your team's pipeline coverage slips below a 3x ratio, that’s a clear warning that the next quarter could be tough. This insight gives you a head start to launch a targeted prospecting initiative now instead of scrambling later. Another predictive metric is tracking the "number of stakeholders engaged" per deal. A deal with only one point of contact is much more fragile than one with four.
When you spot these trends early, you can intervene with targeted actions. This might mean running a team-wide workshop on how to multi-thread accounts or scheduling a one-on-one coaching session on negotiation tactics. This is the essence of using data to drive sales strategy in Ireland and anywhere else—it turns tracking from a reporting chore into your most effective tool for generating real performance breakthroughs.
Your Complete Implementation Roadmap
You’ve sorted out your metrics, picked your tools, and sketched out your dashboards. So, what’s next? It’s time to turn all that planning into a working system. Moving from a great idea to a live platform for tracking sales performance can feel like a huge leap, but if you break it down into smaller, more manageable stages, it’s entirely doable. This isn’t something you’ll knock out over a weekend; it's a deliberate process that needs team support, a bit of patience, and a clear idea of what success looks like.
The first step is to focus on the technical setup and a small-scale pilot. Resist the temptation to roll this out to your entire sales team at once. Instead, pick a small group of two or three reps. I’d recommend choosing one of your tech-friendly top performers and another who’s a bit more skeptical. This small group will be your canary in the coal mine. Their feedback is invaluable for finding bugs, simplifying confusing steps, and proving the system’s worth before you go big. Give this phase a clear timeline, say two to four weeks. Success here isn’t about revenue; it's about user adoption and data accuracy. Are they logging their activities? Is the data coming in clean?
Staging Your Rollout for Team-Wide Success
Once your pilot group has helped you smooth out the kinks, you’re ready for a phased team rollout. Kick things off with a solid training session that goes beyond the "how" and really digs into the "why." You need to show your team how this new system makes their jobs easier—think less admin work, clearer targets, and more effective coaching. One of the biggest hurdles you’ll likely hit is resistance to change. Sales reps guard their time fiercely, and anything that looks like extra paperwork is going to be met with friction.
To get ahead of this, build some positive momentum. Publicly recognize reps who are using the system well. Share quick stories about how the data helped someone get coaching that saved a deal. It's also critical to check if your new tracking system is actually working for the team. After about 60 days, send out a quick survey. Ask questions like:
- Is the dashboard helping you plan your day better?
- How much time are you saving on manual reports?
- Do you feel the data gives a fair picture of your work?
Sustaining Momentum and Evolving Your System
A sales performance tracking system is never really "done." It has to adapt as your team and the market change. Set up quarterly reviews to look at your KPIs. Are they still the right ones to be tracking? Do your benchmarks need a tweak? For instance, if your product pricing changes or a new competitor pops up, you might need to start focusing on different leading indicators to stay ahead.
The ultimate goal is to build a culture where data is a tool for empowerment, not just oversight. When your team truly sees that tracking performance leads to smarter coaching, better leads, and bigger commission checks, they won’t just go along with the system—they’ll become its biggest supporters.
Ready to build a high-performance sales engine in Ireland? At DublinRush, we provide the data-driven frameworks and lead resources your team needs to not just meet quotas, but consistently exceed them.