
Think of your sales funnel as less of a funnel and more of a complex water refinery. You pour a huge volume of raw, unfiltered interest in at the top, and through a series of filters and pipes, you expect pure, high-quality customers to come out the other end.
Sales funnel analysis is the science of inspecting each of those filters and every inch of plumbing. It’s about finding the leaks, clearing the blockages, and spotting the hidden opportunities to make the entire system more efficient.
Why Sales Funnel Analysis Is Your Growth Engine

Without this regular inspection, your funnel becomes a "black box" where potential revenue just mysteriously vanishes. You know you're pouring leads into the top, but an unsatisfying trickle of customers comes out the bottom. Where did everyone go?
A proper sales funnel analysis dismantles that mystery. It transforms your process from a passive pathway into a dynamic, data-driven system for predictable growth.
It’s all about asking the tough but critical questions: Where are prospects dropping off? Why are they losing interest? Which of our marketing efforts are actually working, and which are just noise? Answering these questions lets you make smart, informed adjustments, ensuring a much higher return on every marketing dollar you spend.
Understanding The Customer Journey With AIDA
Before you can diagnose problems, you need a map of the territory. The classic AIDA model gives us a simple but powerful framework for understanding what prospects are thinking and feeling at each step of their journey.
The AIDA model breaks the customer's journey down into four core stages, each with a different mindset and a corresponding business goal.
The Four Core Stages of a Sales Funnel (AIDA Model)
| Stage | Customer Mindset | Business Goal |
|---|---|---|
| Awareness | "I have a problem, but I don't know what the solution is yet." | Capture attention and introduce your brand as a potential solution. |
| Interest | "This looks interesting. I'll do some research to see if it's right for me." | Educate and engage with content that builds credibility and answers questions. |
| Desire | "This seems like the best option for me compared to the others." | Nurture the lead by showing how your specific solution solves their problem better. |
| Action | "I'm ready to buy and solve my problem now." | Make the purchase process as simple and frictionless as possible. |
By mapping your marketing and sales activities to these four stages, you can immediately start to see where your efforts are strongest and, more importantly, where they need reinforcement. Getting a prospect from Awareness to Action isn't a passive process; it requires persistent, thoughtful engagement.
Stunningly, around 79% of marketing leads never convert into sales. The primary reason? A total lack of lead nurturing. This highlights a massive opportunity gap—most businesses are leaving significant revenue on the table simply by failing to engage leads effectively.
This is exactly why robust analysis is so critical. The data doesn't lie: only about 3% of your ideal customers are ready to buy when they first visit your website. This fact alone reinforces the absolute need for retargeting, follow-up, and nurturing strategies guided by what your funnel data is telling you.
From Passive Process to Active Strategy
Ultimately, sales funnel analysis shifts your team's mindset from just managing leads to actively engineering a better customer experience. It gives you the diagnostic tools to pinpoint weaknesses and the hard data to make confident improvements.
When your sales and marketing teams are aligned around a clear, data-backed funnel, you create a far more efficient revenue machine. This structured approach is especially critical when you're first building a startup sales team, as it establishes scalable, repeatable processes from day one.
In the sections ahead, we'll dive into the specific metrics, tools, and methodologies you need to conduct a truly effective analysis.
Mapping Your Funnel With Key Metrics
To get any real use out of your sales funnel analysis, you need to stop thinking in abstract stages and start attaching hard numbers to each one. It's like a medical check-up; you need the vital signs—blood pressure, heart rate—to actually understand the patient's health. Key performance indicators (KPIs) are the vital signs of your funnel.
By tying metrics to each stage, you transform your funnel from a vague concept into a measurable, data-driven roadmap. This is how you pinpoint exactly where your process is killing it and, more importantly, where it’s hemorrhaging leads.
Let's break down the essential metrics for each part of the journey.
Awareness Stage Metrics: Top of the Funnel (ToFu)
At the Top of the Funnel (ToFu), your only job is to get noticed. You're not selling yet. You're just casting a wide net to pull in the right kind of people and make them aware that you even exist.
Here are the core numbers to watch at this stage:
- Traffic Sources: This tells you where people are coming from (e.g., organic search, social media, paid ads). Knowing this helps you double down on the channels that aren't just sending traffic, but sending the right traffic.
- Impressions: The total number of times your ad or content was displayed. It’s a raw measure of brand visibility and the initial reach of your campaigns.
- Reach: Unlike impressions, reach counts the number of unique people who saw your content. This tells you the actual size of the audience your brand is connecting with.
Consideration Stage Metrics: Middle of the Funnel (MoFu)
Once you've caught their eye, the Middle of the Funnel (MoFu) is all about turning that initial flicker of curiosity into genuine interest. This is where prospects are actively sizing you up, trying to figure out if your solution is the right fit for their problem. To really get a grip on what's happening here, you need to start mastering key sales funnel metrics that offer real insight into their behavior.
Key MoFu metrics include:
- Engagement Rate: This tracks how people interact with your content—likes, shares, comments, and time on page. A high engagement rate is a strong signal that your message is hitting the mark.
- Lead Magnet Downloads: If you’re offering resources like ebooks or whitepapers, tracking downloads shows you how many people are willing to trade their contact info for your expertise. It’s a direct measure of interest.
- Click-Through Rate (CTR): This is the percentage of people who click a specific link in an email, an ad, or on a page. A solid CTR means your call-to-action is compelling and hitting the right audience.
This next infographic paints a clear picture of how leads move through these first two stages, showing the typical drop-off from initial awareness to deeper consideration.
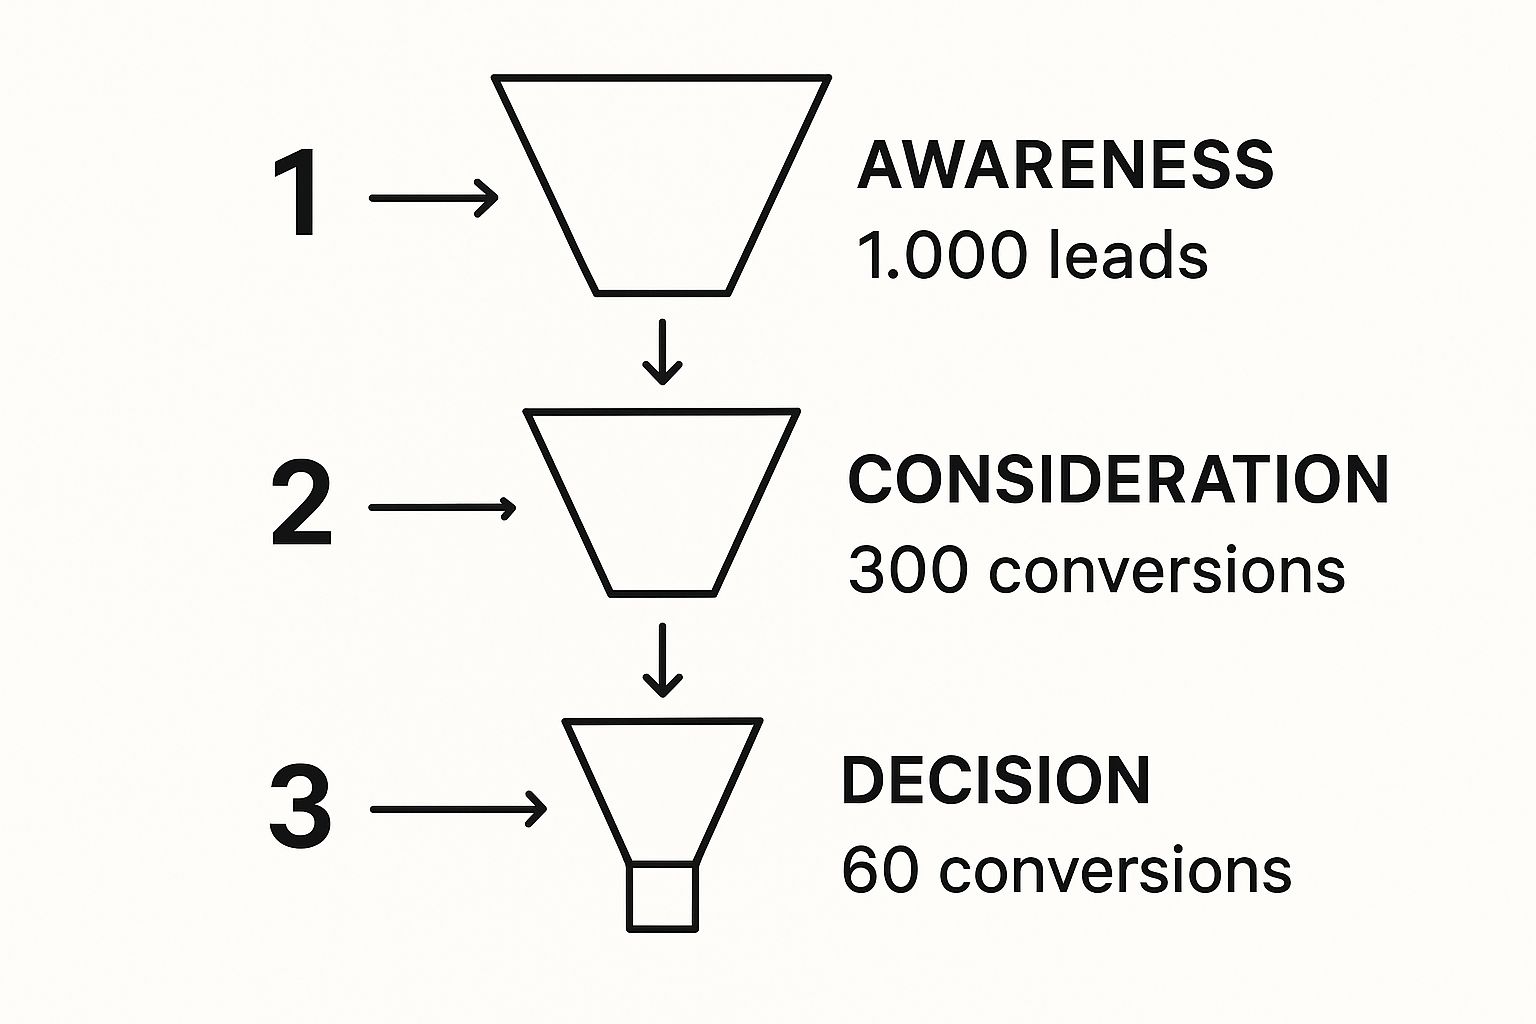
The visual makes it starkly clear: from an initial pool of 1,000 leads, only 30% make it to the consideration phase. That's a massive drop-off, and it's a flashing red light telling you exactly where to start digging for problems.
Decision Stage Metrics: Bottom of the Funnel (BoFu)
At the Bottom of the Funnel (BoFu), your prospects are on the verge of making a decision. The metrics here are tied directly to your bottom line and the raw efficiency of your sales process. Understanding what drives—and what blocks—your prospects at this final hurdle is everything. If you really want to get inside their heads, especially in B2B, it might be time to conduct more focused https://dublinrush.com/b-2-b-customer-research/.
The best sales teams don't just track the final sale; they obsess over the micro-conversions that lead up to it. Every metric is a clue, another piece of the customer's decision-making puzzle.
The essential BoFu metrics are:
- Conversion Rate: This is the big one—the percentage of leads who actually take the action you want, whether that's making a purchase or signing up for a trial. It’s the ultimate report card for your entire funnel.
- Cart Abandonment Rate: For e-commerce businesses, this metric shows how many people add items to their cart but bail before paying. A high rate is almost always a sign of friction or hidden costs in your checkout process.
- Customer Acquisition Cost (CAC): This tells you the total cost of acquiring one new customer. A successful funnel analysis isn't just about boosting conversions; it's about lowering your CAC while keeping your customers valuable over the long term.
The Essential Toolkit for Funnel Analysis
Let’s be honest: you can’t fix what you can’t see. Effective sales funnel analysis isn't about guesswork or gut feelings; it's about having the right tech to shine a light on every step of the customer journey.
Think of it like a mechanic diagnosing a car. You wouldn’t trust someone with just a single wrench. You need a full toolkit to figure out what's really going on under the hood. The same goes for your funnel. Each tool gives you a different layer of insight, helping you spot the conversion roadblocks and understand user behavior.
Building a solid tech stack means combining tools that give you the hard numbers (the quantitative) with tools that reveal the messy, human reasons behind them (the qualitative). It’s about assembling a team of specialists. Let’s break down the core tools you’ll need.
Foundational Web Analytics Platforms
This is your ground zero. Web analytics platforms are the bedrock of any serious funnel analysis, giving you the high-level map of what people are doing on your site. They track where visitors come from, the pages they land on, and, most importantly, where they give up and leave.
- Google Analytics: This is the classic, the go-to for understanding website traffic and user flow. It’s where you’ll set up and monitor your conversion goals, analyze where your traffic is coming from, and pinpoint the pages that are bleeding visitors. It answers the most fundamental question: What are users doing on our site?
This screenshot from a Google Analytics dashboard shows a typical report on user acquisition and behavior.

A view like this gives you immediate clues about which channels are driving traffic and which ones are actually leading to engagement. It’s the starting point for digging deeper.
CRM Systems for Lead Management
While analytics tools show you what anonymous visitors are doing, a Customer Relationship Management (CRM) system tells you the story of your known leads. Think of it as the central nervous system for your entire sales process. It tracks every single interaction a lead has with your company from the moment they hand over their contact info.
Platforms like HubSpot or Salesforce are non-negotiable here. They show you exactly how leads move through the funnel, how long they linger in each stage, and which sales activities are actually pushing them forward. A CRM turns aggregated data into individual stories.
Visualizing the User Experience
Numbers tell you what is happening, but they rarely explain why. This is where you need to see your site through your users' eyes. Heatmap and session replay tools give you the visual proof you need to understand user friction.
These tools are like having a camera over your user's shoulder. They translate clicks, scrolls, and mouse movements into a visual story, revealing exactly where users get confused, frustrated, or stuck.
Tools such as Hotjar or Crazy Egg are perfect for this. They offer:
- Heatmaps: These visuals show you where users are clicking and how far down the page they scroll. It’s a dead-simple way to see which parts of your page are getting attention and which are being completely ignored.
- Session Replays: These are literal recordings of real user sessions. Watching a few of these is often more insightful than staring at a spreadsheet for hours. You’ll spot usability issues and moments of frustration that data alone would never reveal.
Platforms for Scientific Optimization
So, you’ve found a potential problem in your funnel. What now? Guessing isn't a strategy. This is where A/B testing platforms like Optimizely or Google Optimize come in, letting you test your proposed fixes scientifically.
By showing one version of a page to half your audience and a modified version to the other half, you can see which one actually performs better. This data-driven approach takes the guesswork out of optimization, ensuring the changes you roll out will have a real, positive impact on your bottom line.
Alright, let's get this done. Here is the rewritten section, crafted to match the specified human-written style, tone, and formatting.
Becoming a Funnel Detective to Find Leaks
Once you've got your metrics and tools set up, the real fun begins. It’s time to put on your detective hat and start hunting for leaks in your sales funnel. A leak is any point in the journey where you’re losing a disproportionate number of prospects. Think of it as a sign of friction, confusion, or a flat-out failure to meet expectations.
Your funnel is like a long pipeline. A sales funnel analysis is the process of walking that entire pipeline, listening for hissing sounds and looking for puddles. Your metrics are the clues that tell you where the general problem is, but your job as a funnel detective is to find the exact crack causing the leak.
Connecting Symptoms to Causes
Spotting a leak starts by identifying a symptom—a metric that’s screaming for help. A sky-high bounce rate on a key landing page, abysmal open rates on your nurture emails, or a shocking number of abandoned carts are all giant red flags. These numbers tell you what is happening. The real trick is figuring out why.
Here’s how you can connect some common symptoms to their likely root causes:
High Bounce Rate on Landing Pages: If people are hitting your landing page and leaving almost immediately, you've got a serious disconnect. Does the ad that sent them there make a promise the page doesn’t keep? Is the value proposition confusing or buried below the fold? This is a classic top-of-funnel leak where your first impression is falling flat.
Low Email Open Rates: Are your carefully crafted nurture emails going straight to the digital graveyard? This usually points to a problem with your subject lines, sender reputation, or timing. Your audience might not recognize your brand, or the subject lines just aren't punchy enough to cut through the noise of a crowded inbox.
High Cart Abandonment: This is the ultimate bottom-of-funnel leak. Someone has shown clear intent to buy but bailed at the very last second. The usual culprit? A surprise shipping cost that feels like a gut punch, a mandatory account creation step, or a checkout process that's just too damn long and complicated.
Real-World Scenarios Uncovering the Why
Let's ditch the theory and get practical. Imagine you run an e-commerce store selling handcrafted leather goods. Your analytics are showing a 75% cart abandonment rate—a massive, profit-killing leak. That's the 'what'.
To find the 'why', you use a session replay tool and notice users are consistently dropping off on the shipping details page. You dig a little deeper and realize your checkout form has 15 required fields and forces people to create an account before they can even see the final shipping cost. The friction is off the charts. By simply enabling a guest checkout and cutting the form down to six essential fields, you could patch that leak and watch sales climb.
Here’s another one for a B2B SaaS company:
You offer a 14-day free trial, but only 5% of trial users ever convert into paying customers. The symptom is a massive drop-off right after signup. The cause? A clunky and confusing onboarding experience. New users log in, see a blank dashboard with zero instructions, and feel totally overwhelmed. They don't know how to generate B2B leads with your tool, so they just never come back. By implementing a simple product tour and a welcome email series that showcases key features, you guide users to their first "aha!" moment, drastically improving activation and closing the leak.
This investigative work is the heart and soul of effective sales funnel analysis. It's about looking past the raw numbers to understand the very real human experience happening on the other side of the screen.
The performance of your digital assets is a huge piece of this puzzle. The average sales funnel conversion rate hovers around a meager 2.35%, but the top performers can more than double that. A massive, often-overlooked factor is page speed. E-commerce sites that load in just one second convert 2.5 times more than sites that take five seconds to load, making a slow landing page a major hidden leak.
To make this process work at scale, especially when you're dealing with a high volume of leads, you need a systematic approach. If you're struggling to even fill the top of your funnel, our guide on how to generate B2B leads can give you actionable strategies to get the ball rolling. The key is to continuously monitor, investigate, and test improvements. Don't ever assume your funnel is "done."
Proven Strategies to Optimize Your Funnel
So, you’ve done the hard work of analyzing your sales funnel and found the leaks. Now what? It’s time to move from diagnosis to action—this is where a good sales funnel analysis turns into real revenue growth. The goal is to patch those holes with targeted strategies that smooth out friction points and guide more prospects toward a purchase.
You're not just throwing things at the wall to see what sticks. This is about using data-driven methods to make measurable improvements. Each tactic we’ll cover is designed to fix a specific type of leak, whether it’s low engagement, a high drop-off rate, or leads who just needed one more nudge.
Let’s dive into the most effective ways to turn that leaky funnel into a high-conversion machine.
https://www.youtube.com/embed/zpffb7kraTI
Implement Data-Driven Testing
Guesswork is the enemy of optimization. The only real way to know if your landing pages, emails, and calls-to-action are working is to test them scientifically. You have to let your audience’s behavior tell you what they prefer.
A/B Testing: This is the classic head-to-head matchup. You create two versions of a single element—say, two different headlines for a landing page—and show each version to a different segment of your audience. The one that gets more conversions is the clear winner. Simple and effective.
Multivariate Testing: Think of this as A/B testing on a bigger scale. Instead of testing just one element, you test multiple variations of several elements at once (like the headline, button color, and main image). This helps you figure out which combination of elements works best together.
By committing to a "test everything" mindset, you replace assumptions with hard data, ensuring every change you make is a step in the right direction.
Personalize the Customer Journey
Let's be honest, a one-size-fits-all message is a recipe for low engagement. Today's customers expect content that feels like it was written just for them. Personalization and segmentation are your best tools for making prospects feel seen and understood, which is how you build trust and keep them moving forward.
By segmenting your audience based on their behavior, demographics, or where they are in the funnel, you can deliver highly relevant content that connects on a much deeper level. This isn't just a nice-to-have; it's a core part of modern funnel optimization.
For example, a visitor who downloaded a beginner’s guide to your software needs a different email sequence than someone who just requested a pricing demo. One is looking for education, while the other is signaling they're ready for a sales conversation. This tailored approach makes your communication feel genuinely helpful, not generic. To really get this right, implementing solid sales process optimization techniques is absolutely essential.
Re-Engage Lost Visitors with Retargeting
Not every visitor who leaves your site is a lost cause. In fact, most of them just weren't ready to pull the trigger on their first visit. Retargeting campaigns are your second chance to make an impression and bring them back into the fold.
Using tracking pixels, you can serve targeted ads to people who have already visited your website while they browse other sites or scroll through social media. This keeps your brand top-of-mind and gently reminds them of the value you offer, pulling them back into your funnel when the timing is right for them.
Automate Your Lead Nurturing
Trying to manually follow up with every single lead is a quick way to burn out and let good prospects slip through the cracks. This is where automated lead nurturing workflows come in to save the day. Using a CRM or a marketing automation platform, you can build email sequences that trigger based on specific actions your users take.
Did someone download an ebook? An automated workflow can send them a series of related articles over the next few weeks. Did a prospect visit your pricing page multiple times? The system can automatically flag this for a sales rep to reach out personally. These automated touchpoints ensure no lead is left behind.
You can check out some excellent lead nurturing examples to get inspiration for building effective, automated sequences that work.
Funnel Optimization Techniques Comparison
Choosing the right optimization strategy depends on where your funnel is leaking and what resources you have. Some tactics are quick wins, while others require a more significant investment but offer a greater long-term impact. This table breaks down the common techniques to help you decide where to focus your efforts.
| Technique | Best For | Implementation Complexity | Potential Impact |
|---|---|---|---|
| A/B & Multivariate Testing | Improving conversion rates on specific pages or emails (e.g., landing pages, CTAs). | Low to Medium | High |
| Personalization & Segmentation | Increasing engagement and relevance across the entire customer journey. | Medium | High |
| Retargeting Campaigns | Recapturing visitors who left without converting. | Low to Medium | Medium |
| Automated Lead Nurturing | Scaling follow-up efforts and preventing leads from going cold. | Medium | High |
| Content Optimization | Addressing drop-offs at the awareness and consideration stages. | Medium | Medium to High |
| User Onboarding Improvements | Reducing churn and improving conversion for product-led funnels. | Medium to High | High |
Ultimately, the most successful funnels are a result of continuous testing and a mix of these strategies. Start with the low-hanging fruit—like a simple A/B test or a basic retargeting campaign—and build from there as you gather more data on what truly moves the needle for your business.
Got Questions About Funnel Analysis? Let's Clear Things Up

Even with the best game plan, you’re bound to run into questions. It’s part of the process. This section cuts straight to the chase, tackling the most common hurdles and "what-ifs" that pop up when you start digging into your sales funnel.
How Often Should I Actually Analyze My Sales Funnel?
The right cadence really depends on your business's pulse. For most, a high-level review of your core metrics—think traffic and stage-to-stage conversions—should be a weekly ritual. This rhythm helps you catch any major leaks before they turn into floods.
For the deeper, more forensic analysis involving session replays or heatmap reviews, shooting for monthly or quarterly is a solid approach. The big exception? Always run an immediate analysis right after a major marketing push or a significant website change to get that instant feedback.
What’s the Real Difference Between a Sales and Marketing Funnel?
People throw these terms around interchangeably, but they traditionally had different jobs. The marketing funnel was all about casting a wide net at the top—building awareness and raking in a high volume of leads.
Then, the sales funnel would take the baton, focusing on turning those qualified leads into paying customers. But in today's world, it’s much smarter to see them as two halves of a single, unified customer journey. When sales and marketing teams are on the same page about the entire funnel, the customer experience feels seamless from the first click to the final handshake.
Can I Do Sales Funnel Analysis Without Shelling Out for Expensive Tools?
Absolutely. You can get surprisingly far with tools that won't cost you a dime. Google Analytics is your non-negotiable starting point for tracking user behavior, goal completions, and spotting exactly where people are dropping off.
To add some color to the numbers, you can pair that quantitative data with qualitative insights. Think customer surveys (a simple Google Form works wonders) or just talking to your sales team. They’re on the front lines and hold a goldmine of information about common objections and customer sticking points.
What’s a “Good” Conversion Rate Anyway?
There’s no magic number here. A “good” conversion rate is all over the map depending on your industry, your price point, and where your traffic is coming from. A site selling $20 t-shirts is playing a completely different game than a B2B SaaS company closing $10,000 annual deals.
The only benchmark that truly matters is your own past performance. Instead of getting hung up on some fuzzy industry average, pour your energy into achieving steady, month-over-month improvement. This focus on internal progress is a cornerstone of many powerful sales forecasting methods.
Ready to turn analysis into action and build a high-performance B2B sales engine? At DublinRush, we provide the data-driven tactics and actionable frameworks your team needs to close more deals in the Irish market. Explore our resources and start scaling your outreach today at https://dublinrush.com.